Signals I Use for Day Trading Options
Options Day Trading
CAUTIONS AND WARNINGS!
Day trading options is not for the faint of heart. If you don't know what you're doing, you can lose a lot of money - up to your entire trading account, or even more!
This is NOT an article for beginning traders. If you don't understand how options work, what the greeks or time decay are, or how leverage works, stop reading this article and come back once you have learned these things.
Unless you are already experienced with day trading options, I highly suggest you paper trade for at least three months before you start trading in your account. Why? You need at least this long to see how things really work.
I discovered, by paper trading, that there is really only one or two weeks of the month during which my style of trading is most effective. I also learned why trading at or in the money options was the best way to go for my trading style.
Your trading style will undoubtedly be somewhat different than mine. By paper trading for three months before you start real trades, you will save yourself a lot of money - and misery! You will get time to see the monthly market cycles and how your style of trading works with them. You will learn how time value can cost you a profitable trade, even though the stock is moving the right direction.
Oh, one other thing. I am just a person - not an equities market expert. I am sharing this information in the hopes that it helps you become a better trader, or at least learn more about day trading options so you can decide if this is something you want to pursue.
Two Time Frame Charts and Three Moving Averages
I use two charts when day trading options to help me decide if there is a high probability high profit trade available on the stock.
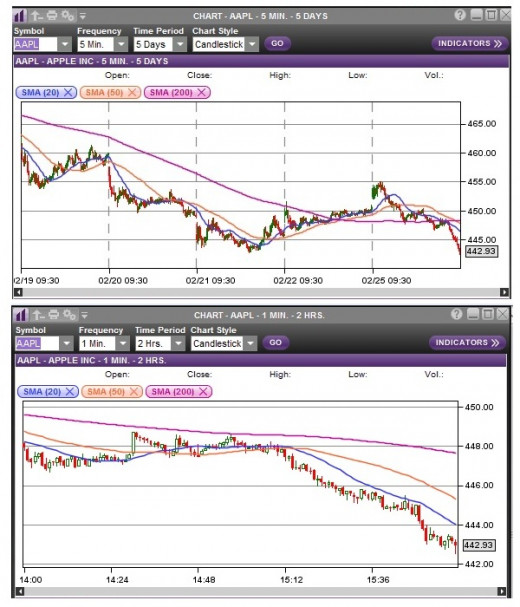
The first chart is a 1-minute 2 hour chart. Rephrased, that is a chart that reports one minute intervals, and shows 2 hours of the stock movement.
The second chart is a 5-minute 5 day chart. Rephrased, this is a chart that reports in 5 minute intervals, and shows 5 days of the stock movement.
I also use a daily 6 month chart to confirm the major trend of the stock.
I use three moving averages on these charts.
The first MA charts 20 periods, where a period is the interval the chart is set for. So on the 1 minute chart, the first MA charts the previous 20 minutes of stock movement.
The second MA charts 50 periods, and the third MA charts 200 periods.
These three moving averages will give you a solid picture of whether the stock is in an uptrend, downtrend, or consolidation phase. The clearest signal is given when both the 20 and 50 lines fall above or below the 200 line - however, the stock may have seen a large portion of it's move by the time the clearest signal shows on the chart.
Let's take a look at the other indicators, then we can move on to how to use them in conjunction to predict high probability profitable trades.
Three Main Indicators
In keeping with the KISS (keep it super simple) practice, I found the more indicators I had, the harder it was to predict anything. This was largely due to information overload. So in addition to price and moving averages, I narrowed my chart information down to just three other indicators.
The first of these three indicators is volume. Volume can help you determine the strength of a trend.
The second of the three indicators is the MACD, which stands for the moving average convergence divergence. This indicator helps with identifying a trend, and also with determining when the trend is changing. I have my MACD indicator set at 12, 26, and 9, but you may find other settings work better for you.
The last of the three indicators is stochastics. This indicator can help you determine if a stock is overbought or oversold, and can help you identify the strength of the trend. I use fast stochastics, set at 14, 3. You may find other setting or slow stochastics are more to your liking or needs.
How I Use These Indicators
Experience has taught me to be extremely cautious when it comes to day trading options. In addition to waiting for all the signals to line up, I use many methods to control losses. I have a complete and thorough trading plan written specifically for options day trading, and it dictates everything I do. This is to remove the emotional element of trading, and also to provide the highest likelihood of success (e.g., profitability) in my trading.
All the indicators in the world won't help you unless you have a good trading system. Good trading systems account for the fact that no matter how good the indicators, sometimes you will be wrong. Have a plan that covers what you do when you are wrong, and when you are right.
That being said, I look for "extreme congruity" between the indicators on the two charts.
If the 20 and 50 day MAs are above or below the 200 day MAs on both charts, that is good congruity. If the price is above or below all the MA lines, that is also good congruity.
If the MACD is above or below 0 on both charts, that is good congruity. One of the reasons I recommend paper trading for three months is so you can learn to fine-tune the way you read the congruencies of the MACD between the two charts. The two charts don't always have to be in agreement for a reasonable trade opportunity, but you need time and experience to help you learn this skill.
Rising or falling volume on both charts provides good congruity. Rising volume indicates rising interest in the trend, and falling volume indicates the trend is running out of steam.
Stochastics are a little tougher. Rather than complete congruency, I like to see a firmly established trend on the longer (5 min 5 day) chart with an opposite reading on the shorter chart. In other words, if the long chart stochastics show an uptrend (rising from the 0 line), then I find the best entry opportunities for a trade often result when the short chart stochastics begin to change from falling toward the 0 line to rising from it. When both charts are at the top or bottom of the range, it has often meant a stall or even reversal may be imminent.
So that's roughly how you read each separate indicator. What I look for next is "extreme congruity," a situation where all of these indicators are saying the same thing.
For a call option trade, price should be above all the MAs, with the 20 MA above the 50 MA, and the 50 MA above the 200 MA. Volume should be steadily climbing (but watch out for huge spikes as these can indicate trend exhaustion). The MACD lines should be above 0, with the green line over the red line (MACD line over signal line). Final confirmation would be the long chart stochastics rising from the 0 line, but preferably still below the 80 line. If you're a fast trade day trader, look for the point when the fast chart stochastics have dropped and are beginning to climb again for a good trade entry point.
The next capsule will look at an example of these indicators in action.
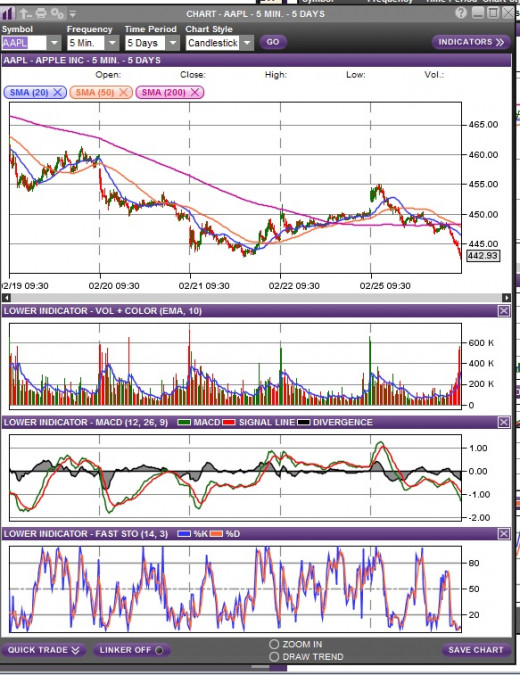
AAPL 5 min 5 day chart
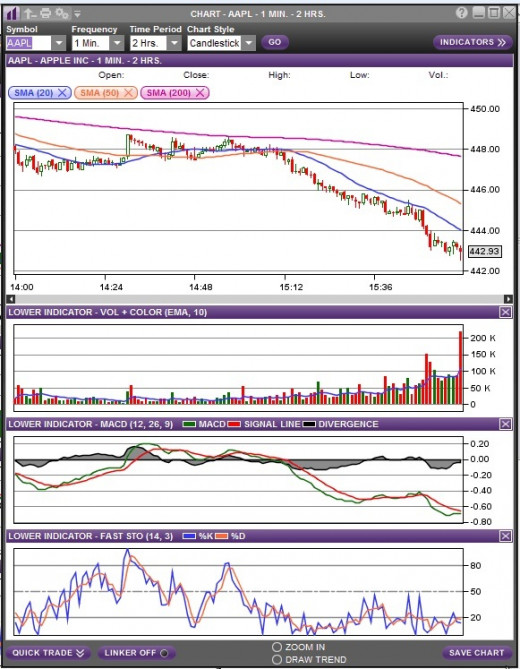
AAPL 1 min 2 hour chart
Pulling It All Together
The following is NOT a recommendation for any trade. It is for illustrative purposes only!
Let's take a look at the chart for AAPL from 2/25/13. First, let's check the 5 minute 5 day chart. It shows that AAPL opened strong with a large gap up from the previous day's close. But between 10:30 and 11:00, the chart was telling us AAPL wasn't destined to stay up.
The first clue comes around 10:30, when the price falls below the 20 day MA. At the same time, the MACD started to fall, with the red line rising above the green line.
At 11:00, the stock stalls for a bit and rides along the 50 day MA. I'm not taking the trade yet, because the signals aren't all lined up, and I'm not a big risk taker. Volume on the downtrend appears to be fading, and the stochastics say the stock has become oversold. The stock continues to fall a bit more, but the majority of the mini-trend had played out.
Around noon, the stock seems to turn around a bit, but again, the signals aren't all lined up. In fact, the 20 day MA has crossed below the 50 day MA - a signal that tells me the stock may be falling again soon. Between 12:00 and 1:00, the stock rallies in a very minor way, but the fading volume tells us that this is not a strong trend. The stochastics have also climbed into overbought territory, but the price remains below the 50 day MA, and the MACD remains below 0.
Around 1:15, the stock starts falling and the volume starts climbing. The MACD remains below 0, and stochastics are starting to plummet in a serious way. Confirmation comes from the 1 minute 2 hour chart, where the 20 MA has dropped below the 50 MA (both are below the 200 MA).
This brings enough signals into alignment that I would have strongly considered a put option trade. However, I would have soon been out of the trade, because around 2:15 the stock stalls and the MACD turns.
At about 3:00, I would have strongly considered going for a second put option trade. The stock price breaks below the 20 MA again, stochastics are falling, and the 20 day MA on the 5 minute chart has dropped below the 200 day MA. The MACD on the 1 minute chart has taken a good dive below 0, and volume is rapidly climbing.
Let's review the signals:
At this point, we have highly congruous MA signals on both charts. The 20 MA is below the 50 MA, and both are below the 200 MA.
Price has fallen below all the MAs.
Volume is climbing, indicating strength in the trend.
The MACD on both charts is below 0, with the green line falling below the red line.
Stochastics are neither overbought nor oversold on the 5 minute chart, meaning there is room for the trend to run.
This is plenty to suggest a high probability of the stock price falling, and suggests that the trend has room to run, giving us a high probability of profit on the trade.
Obviously, this illustration is geared toward showing signals for a put option trade. You'll need to reverse the order of the MAs, and look for the MACD to be above 0 without overbought conditions on the stochastics, and then you should have good signals for a call option trade.
Congratulations!
You managed to make it through this incredibly long discourse!
I sincerely hope that this information helps you attain your trading goals.
This information was gathered from years of personal experience. Please understand that there is no magic formula for trading.
All forms of equity trading involve risk and your broker can help you understand these risks (or at least get you to the disclosure forms).
If you are going to trade options, I highly recommend a visit to the Chicago Board of Options Exchange web site. This site has a plethora of information on options trading.
And again - paper trade, paper trade, paper trade! Don't put your hard earned money on the line until you have a thorough understanding of what you are doing and how it works. Even at that, you are probably going to discover a few things you hadn't known when you start trading with real money.
Try to find someone who has experience trading to sit with you the first few days you start using real money; they can help you navigate your trading platform and the real-world buying and selling process.
Trading stock and options can be fun and profitable, or it can be dismal and expensive. Education can certainly help your experience be more pleasant, and paper trading can help you learn to be profitable without losing a ton of money while you learn.
(I wish someone had told me all this when I was getting started!)
Thanks for reading!

